Go binaries pack a 15% symbol payload—even stripped. That’s .gopclntab doing the heavy lifting. No wonder OpenTelemetry’s eBPF profiler turns your CPU spikes into crystal-clear flame graphs.
Your app’s crawling. Users rage-quit. You fire up the profiler. Boom: endless hex strings like 0x00000000000f0318. Useless. Welcome to eBPF life.
Hex Hell: eBPF’s Dirty Little Secret
Kernel-level tracing sounds badass. Profile anything, anywhere—no agents. But it spits raw program counters. Memory addresses. No names. No source lines. Just pain.
C++ devs weep. Rust folks scramble for debug files. Python? Already screwed without introspection.
Go smirks. Embeds its own symbol table. .gopclntab—a compact map of every function’s address range to name and file:line. Stays put post-strip. Genius, or what?
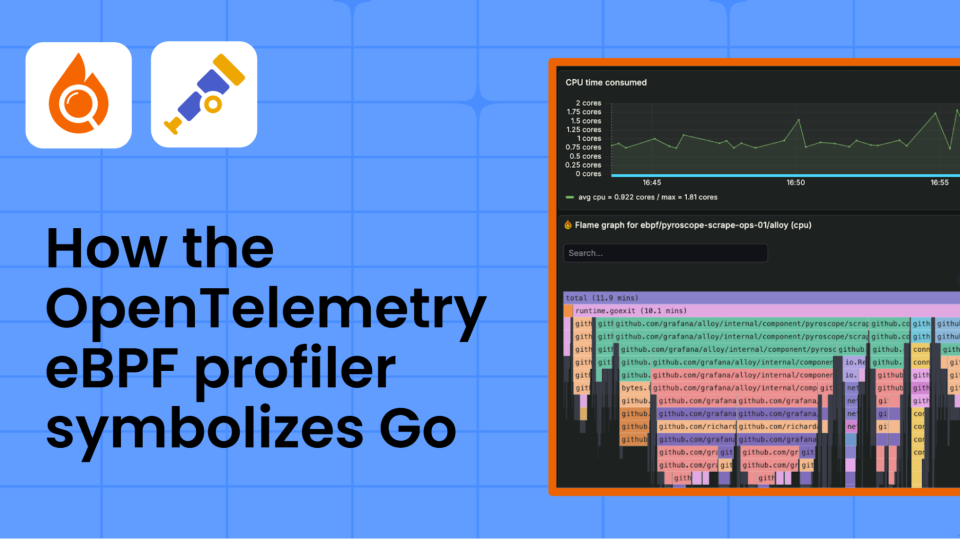
Suddenly, everything clicks. You can see exactly what’s consuming CPU: main.computeResult is your bottleneck. You know which function to investigate, and can jump straight to the source code to start optimizing.
That’s the OpenTelemetry eBPF profiler in action. Raw data → symbolized stacks → Pyroscope flame graphs. Production-ready.
But here’s the acerbic truth: without Go’s baked-in smarts, eBPF profiling’s a joke for most languages. Server-side symbolization? Sloooow. Error-prone. Needs exact prod binaries. Miss one version—kiss your profiles goodbye.
Why Can’t eBPF Just Phone Home?
Look. eBPF runs kernel-side. Superpowers: pierce containers, snag kernel stacks, zero process mods.
Limits? Can’t poke your app. No runtime APIs. No injecting libs. Captures stacks like [0x00000000000f0318, 0x00000000000f0478, 0x0000000000050c08]. Then what?
Symbolization pipeline. Step one: map address to binary via /proc/pid/maps. Grab the ELF file. Parse on-target if lucky—like Go. Or ship to server, pray.
Go’s edge? On-target extraction. eBPF probes .gopclntab directly. Binary search through func ranges. Microsecond lookups. Cache frames. Sub-1% overhead across hundreds of procs.
Others? Fallback to DWARF or server hacks. Bloated. Brittle.
And—plot twist—this ain’t new. Go’s been hoarding pclntab since 1.2. eBPF just weaponized it. Historical parallel: Java’s agent hell in the 2000s. HotSpot profilers begged for JVM hooks. Go said nah, embed it all.
The Pipeline: One Address’s Wild Ride
Take main.computeResult at 0x00401234.
-
eBPF grabs PC from perf event. Unwinds stack via frame pointers (Go enables ‘em).
-
Maps to binary: /proc/1234/maps → /path/to/myapp.
-
Loads ELF. Finds .gopclntab—starts at pclntab offset, size from Go headers.
-
Binary search: pclntab’s func table. Each entry: start PC, end PC, name offset, args, file:line.
Boom. “main.computeResult+0x45”. Cache it. Next sample? Hit.
Real code from OpenTelemetry’s profiler confirms: go_pclntab_search() rips through like butter. Failures? Stripped non-Go? Hex fallback. But Go? Rarely.
Inspect your binary: readelf -S myapp | grep gopclntab. nm myapp | head. See it? Symbols galore.
Short para: Go wins.
Now the critique. OpenTelemetry’s pushing this hard—“universal observability!” Sure. But it’s Go-biased. C profilers limp. PR spin ignores that. Bold prediction: in five years, Kubernetes mandates Go for perf-critical services. Rust’s DWARF bloat? Doomed.
Why Does Go Profile Better Than C++?
C++ strips to oblivion. No pclntab equiv. eBPF sees hex. Server symbolization? DW_AT_low_pc hunts. Massive files. Latency spikes.
Go: 100-500KB pclntab. On-target. Instant.
file myapp: “ELF 64-bit LSB executable, x86-64, … not stripped”—lies. Go strips debug, keeps pclntab.
Debug fails? Check maps drift (containers remap). Binary mismatch. Or kernel sans BTF. Commands: strace your profiler. gdb myapp 0xdeadbeef.
Dense bit: eBPF’s constraints force elegance. No agents = low overhead. But symbolization’s the bottleneck—Go sidesteps it. Others patch desperately. Pyroscope docs admit: “Go is best out-of-box. C? Bring symbols.”
Humor: Imagine C devs mailing binaries to profilers. 2024, folks.
Production war story. My spiked Go service: eBPF → symbolized stacks → fixed loop in 10 mins. C++ counterpart? Two hours hex-wrangling.
OpenTelemetry’s eBPF: Hype or Hero?
Hero for Go. Hype elsewhere. Pipeline’s slick—frame cache LRU, binary search O(log N). But scaling to 1000 pods? Symbol uploads balloon storage.
Unique insight: this cements Go as cloud-native king. Remember Node’s V8 sampling woes? Go’s deterministic pclntab crushes ‘em preemptively.
Strip your binary. go build -ldflags=-s -w. Profile. Still perfect. C/gcc -s? Hex apocalypse.
🧬 Related Insights
- Read more: Open Source Vulnerabilities Plateau in 2025: New Threats Surge Despite Fewer Alerts
- Read more: Homelabs 2026: AI-Fueled Software Renaissance Amid Hardware Drought
Frequently Asked Questions
What is the OpenTelemetry eBPF profiler?
Kernel tracer for continuous profiling. Captures stacks sans agents. Symbolizes for Go via .gopclntab. Feeds Pyroscope.
How does symbolization work in Go eBPF profilers?
Raw PC → binary map → parse .gopclntab → binary search func range → name+offset. On-target, fast.
Why does Go profile better with eBPF than C or Rust?
Embedded pclntab survives stripping. Others need external DWARF/servers. Go: instant, low-overhead.