What if your innocent log hunt just nuked your budget?
Query fair usage in Grafana Cloud sounds generous — up to 100x your monthly ingested log volume in GBs, gratis. But here’s the kicker: screw up, and you’re paying extra. Grafana admits it works for most, yet warns of surprise bills if you’re not ‘careful and strategic.’ Yeah, because who plans every query?
It’s a billing guardrail for their Loki engine, which chews massive data. Without it, a few query hogs could tank shared infra. Predictable costs? Check. Efficient habits? Encouraged. Abuse-proof? Supposedly.
Take their example: ingest 50 GB logs monthly. Free queries: 5,000 GB scanned. Exceed? Pay up. Simple math — until it’s your wallet.
Ever Previewed a Query’s True Cost?
Grafana’s Explore view estimates data scanned pre-run. Smart, right? But most folks miss it, barreling into overages blind.
Head to the billing dashboard — or the shiny new Cost Management page, since the old one’s toast soon. Under Logs, spot your query usage ratio. That’s your allowance eater, right there.
Who’s the Query Culprit in Your Stack?
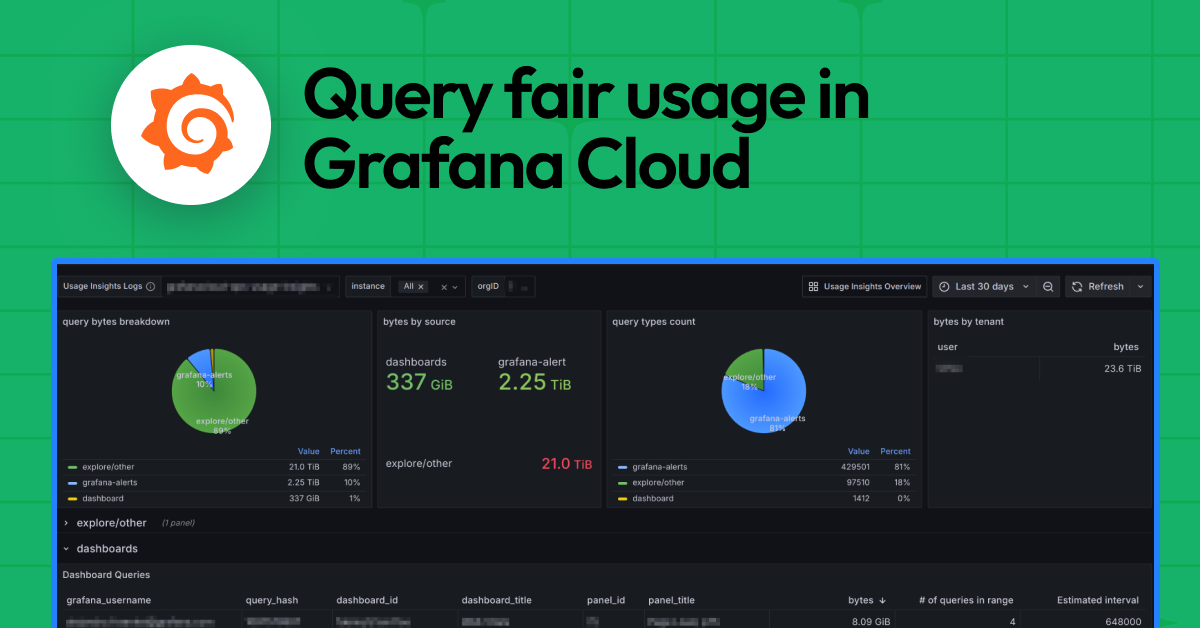
They’ve got a Loki query fair usage dashboard, auto-provisioned for hosted Grafana. Breaks down by type: Grafana-alerts (those alerting rules), Explore/other (ad-hoc dives, logcli junk), dashboards.
“The dashboard shows a breakdown of your query usage, query type, dashboard, grafana-alert, and Explore/other, by query bytes and query count.”
Top queries listed: the offender, username, size, frequency. Brutal honesty — or finger-pointing at your devs.
Estimated interval? Query runs divided by time range. Pinpoints the repeat offenders.
And Grafana-alerts? That’s Grafana-managed rules, not your Loki uploads via cortextool or lokitool. Subtle split — easy to miss.
But wait.
This ‘fair usage’ reeks of early cloud billing games. Remember AWS’s ‘free tier’ surprises in 2010? Everyone got burned on data transfer. Grafana’s spinning efficiency, but it’s really about capping their compute costs. Bold prediction: as logs explode with AI traces, that 100x shrinks — or prices spike. Vendor lock-in, incoming.
Why Does This Matter for DevOps Teams?
Your logs observability practice? It’s now a budget battleground. Ingest more, retain longer (minimum 30 days, extra costs per stream), and queries multiply. Heavy dashboards or alert rules? They’re silent killers.
Best practices? They push policies — but it’s on you. Filter queries ruthlessly. Use aggregations. Avoid full scans.
Look, Grafana’s not evil. Generous for casuals. But for serious ops? This policy screams ‘pay for power.’ Corporate hype calls it ‘protection’; I call it profit padding.
Short tip: Set alerts on that usage ratio. Before it hits 80%. Don’t be the chump.
And retention? Custom per stack or stream. But more days mean more queryable data — tempting fate.
Trapped by Your Own Alerts?
Grafana-alerts dominate usage often. Those recording rules evaluate constantly. Tweak intervals. Prune dead ones.
Explore queries? Blame the devs poking logs endlessly. No username? Some CLI ghost.
Dashboard panels auto-refresh? Query vampires.
Fix: LogQL mastery. Downsample. Label filters early.
It’s work. But beats bills.
🧬 Related Insights
- Read more: GuGa Nexus: No More Staring at Training Runs That Crash
- Read more: Linux DNS Layers: Why Debuggers Fail You
Frequently Asked Questions
What is query fair usage in Grafana Cloud?
It’s a policy letting you scan 100x your ingested log GBs for free; over that, you pay extra to prevent abuse.
How do I check my Grafana Cloud query usage ratio?
Dive into Cost Management > Logs, or the Loki query dashboard for breakdowns by user, type, and top queries.
Will Grafana’s query fair usage cause surprise bills?
Yes, if you’re sloppy — heavy alerts or Explore dives can exceed limits fast; monitor religiously.