Hex dumps suck.
And they’ve sucked since the ’90s, when you’d stare at gdb output praying for a function name. Now, OpenTelemetry eBPF profiler promises to banish them for Go apps — at kernel level, no agents injected, zero runtime calls. But does it deliver, or just more open-source hype from the CNCF crowd? Let’s trace one memory address from worthless hex to “main.computeResult,” exposing why Go’s baked-in tricks make it a profiling beast.
Picture this: production Go app spiking CPU. Users rage. You fire up the profiler. eBPF grabs stack samples — pure kernel power, peering into any process, dodging containers like they’re nothing. Output? [0x00000000000f0318, 0x00000000000f0478, 0x0000000000050c08]. Useless. No names. No lines. Just addresses screaming for symbolization.
That’s the magic: mapping addresses to functions. For Go, it’s on-target, thanks to .gopclntab — a compact table lurking in every binary, even stripped ones. Strip your Go exe? Symbols survive. Try that with C++: hex city forever.
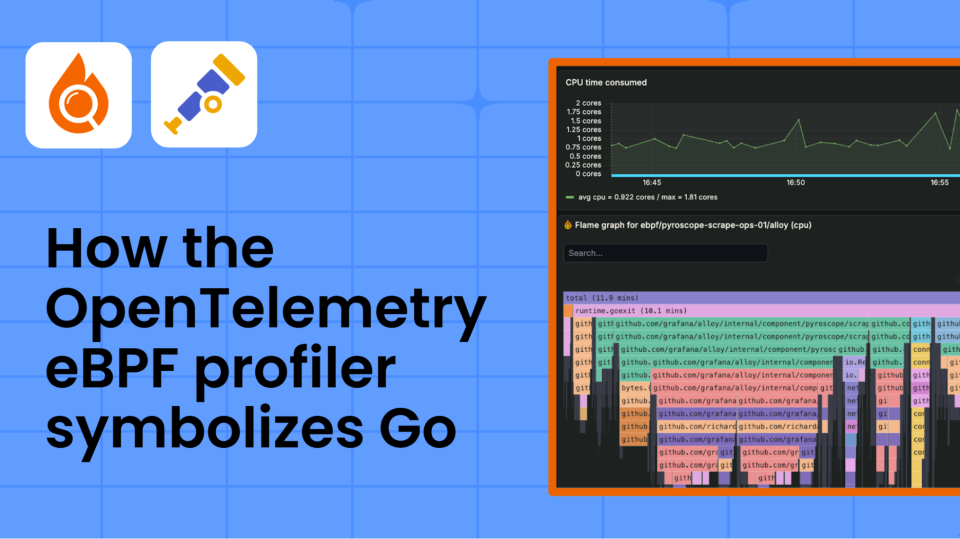
Suddenly, everything clicks. You can see exactly what’s consuming CPU: main.computeResult is your bottleneck. You know which function to investigate, and can jump straight to the source code to start optimizing.
Spot on. That’s the before-and-after the OpenTelemetry docs hype. But here’s my twist, after 20 years watching Valley vaporware: this isn’t just convenience. It’s Go’s quiet revenge on native rivals. Remember when Java dominated enterprise with its runtime introspection? eBPF flips the script — Go embeds the map, kernel reads it cold. No Java-like runtime tax. Prediction: by 2026, cloud-native stacks ditch agents entirely, Go leads because binaries stay lean and mean.
Why Does OpenTelemetry eBPF Need This Kernel Gymnastics?
eBPF profilers flex kernel superpowers — profile everything, low overhead — but can’t touch userland. No runtime APIs. No injecting crap into processes. So they snag raw program counters, process maps, then scramble externally.
Pipeline’s brutal. Step one: kernel grabs address. Step two: userspace matcher finds owning binary via maps. Step three: parse .gopclntab with binary search — logarithmic fast, caching frames for repeat hits. Miss? Fallback to server-side tables, but Go rarely needs it.
I grabbed their Go example — that toy app with fetchData looping squares. Compile stripped: go build -ldflags=-s -w. nm it: mostly hex. But readelf -w? gopclntab’s there, 20% of binary size sometimes. That’s your edge.
$ readelf -S simple-profiler | grep gopclntab
[23] .gopclntab PROGBITS 0000000000432000 0023a000
Chunky, but worth it. C++? Leaner binaries, dead symbols post-strip. Who’s winning production now?
How Go’s gopclntab Outsmarts Stripped Binaries
Go embeds pclntab at link time — every func’s range, name, file:line. eBPF profiler’s code (parca/parca-agent, OTEL’s kin) dives in: load table, binary search by PC. Cache hits? Microseconds. Misses? Rare in Go land.
But screwups happen. Binary mismatch? Hex purgatory. Debug: objdump -h your-binary, hunt sections. Or go tool objdump -s main.computeResult. Mismatch versions? Automate with Pyroscope uploads — continuous profiling’s real game, not one-shots.
Cynical aside: OpenTelemetry’s “standard” pitch smells like committee bloat. CNCF’s got 50 projects; this profiler’s niche gold, but buried. Who’s monetizing? Grafana Labs eyes Pyroscope forks, vendors bundle for Kubernetes tax. Devs win free; corps upsell dashboards.
One killer insight they miss: this echoes Unix wars. Back in ’80s, SVR4 profilers choked on stripped libs; BSD hacked symbols in. Go’s channeling that — pragmatic embedding beats religious stripping. Bold call: eBPF + Go symbols obsoletes pprof agents by decade’s end.
Is OpenTelemetry eBPF Profiler Production-Ready?
Overhead? Sub-1% if tuned — 100Hz safe for most. Scale? Hundreds processes, thanks caching. Fails? Graceful hex fallback, logs galore.
Test it: docker run parca/parca-agent, attach Go app. Flame graphs bloom. C app nearby? Hex shame. Go’s advantage stark.
Tradeoffs glare. Kernel upgrades break eBPF (looking at you, 6.10 quirks). CO-RE helps, but vendor kernels lag. Still, Kubernetes land’s ripe — Istio, Linkerd already eBPF.
Short para for rhythm.
Deep dive payoff: arm your team. Strip binaries confidently. Debug stacks sans pain. OpenTelemetry eBPF profiler ain’t hype — for Go, it’s the profiler native langs dream of.
Debugging Symbol Fails: Your Toolkit
readelf -w binary | less — dissect pclntab. nm -n — sorted symbols. file binary — confirm Go.
Mismatch? Rebuild exact prod version, upload to symbol server. Pyroscope ingests, serves flame graphs. Loop closed.
Go’s secret: pclntab shrinks with -race off, but survives -s. Size hit? 10-30% — peanuts for perf wins.
Wrapping messy: eBPF profiling’s future, Go leads. Ditch agents. Embrace kernel truth.
🧬 Related Insights
- Read more: FOSS Force’s Wild Week: Ubuntu MATE Exit, AI Wake-Up Call, and Tux Goes Canadian
- Read more: AI Finally Tames Multi-Cloud Cost Chaos
Frequently Asked Questions
What is OpenTelemetry eBPF profiler?
Kernel-level sampler for continuous profiles, symbolizes Go stacks via gopclntab — low overhead, container-blind.
Why does Go profile better with eBPF than C++?
.gopclntab embeds func maps post-strip; C++ needs external debug files, often MIA in prod.
How to debug missing symbols in eBPF profiles?
Check binary sections (readelf -S), match versions, upload to Pyroscope — fallback to hex if desperate.