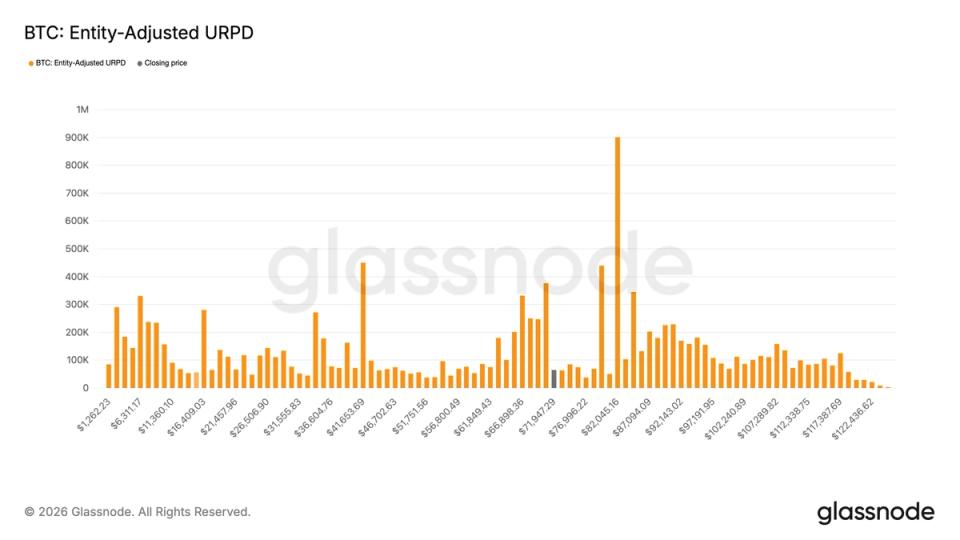
1.85 million BTC. That’s the stack now anchored in the $60,000 to $70,000 range—up a whopping 844,275 coins since January 1.
Glassnode’s data doesn’t lie.
Buyers pounced.
And here’s the kicker: this band now holds 9.23% of Bitcoin’s circulating supply, turning what was a dip into a potential fortress.
The On-Chain Smoking Gun
Look, blockchain sleuths at Glassnode track this via their Realized Price Distribution—entity-adjusted, no less. It groups coins by owner, averaging acquisition prices for UTXOs (those wallet chunks you never think about). The result? A heatmap where $60K-$70K lights up like a Christmas tree.
“This increase of 844,275 BTC indicates that some market participants aggressively bought the dip below $70,000.”
Spot on. Sellers who grabbed here? They’re underwater if price tanks further—reluctant to dump at a loss. Classic HODL psychology, amplified by institutions.
But wait—$70K to $80K? A ghost town. Just 400,000 BTC. Half the lower band’s heft. That’s your air gap, folks: low supply means any buying spark could rocket price through, or sellers could cap it. Thin liquidity cuts both ways.
Bitcoin’s danced below $70K for weeks amid Iran-U.S. jitters. Oil spiked past $100, stocks cratered, yet BTC held firm. Ceasefire hits? Boom—above $70K, eyeing $76K with Morgan Stanley’s ETF debut fueling the fire.
Does This Echo Past Bull Cycles?
Remember 2017? Similar story. Accumulation piled up around $1,000-$2,000 post-halving vibes—then whoosh, 20x run to $20K. Fast-forward to 2021: $30K-$40K zone fattened before the $69K peak. History rhymes.
My take? This isn’t hype. It’s tactical. Whales and funds aren’t blinking at macro noise—rate cut bets vanishing, oil swings be damned. They’re building a base. Bold call: if $70K holds, $100K by year-end isn’t wild. (Yeah, I said it—Glassnode’s supply dynamics back it.)
Critics whine about volatility. Fair. But traditional assets wilted here—S&P down 5% on oil fears, BTC? Up 2% post-ceasefire. Crypto’s decoupling, or at least dip-buying’s winning.
One caveat. Entity-adjusted hides some exchange flows—illiquid OTC deals might skew it. Still, the trend’s undeniable.
Why the $70K-$80K Vacuum Spells Opportunity (or Trap)
400,000 BTC up there. Versus 1.85 million below. That’s a 78% drop-off in supply concentration. Price zips through low-resistance zones.
Think vacuum. Suck prices higher on volume. Or—flip side—profit-takers at $80K could smother it. But with ETF inflows (Morgan Stanley’s a beast), demand looks stacked.
Oil’s plunging 16% to $95. Strait of Hormuz open. Risk-on mode. BTC cleared its 50-day MA. Technicals align.
So, does this make $60K-$70K the unbreakable floor? Damn near. 2.2% of total supply at $70K alone—fourth biggest cluster. Sellers? They’d need a bloodbath to crack it.
Is Bitcoin’s Dip-Buying a Bullish Bet or Fool’s Gold?
Fool’s gold if geopolitics reignite—Iran truce feels fragile. But data says buyers believe. Aggressively.
Unique angle: compare to gold. Physical stacking surged in 2022 chaos, yet BTC’s digital edge (24/7, programmable) draws younger money. Institutions aping retail conviction.
Prediction time. Break $80K clean? Targets $95K quick—air gap physics. Fail? Tests $60K support. Odds favor up.
Markets priced out 2026 cuts—Fed hawkish. Crypto stayed bid. That’s conviction.
🧬 Related Insights
- Read more: Bitcoin ETFs Gobble $471M—Price Goes Nowhere
- Read more: Diamante’s $1.5M Raise Arms Blockchain Against Quantum Doom
Frequently Asked Questions
What does Bitcoin’s $60K-$70K accumulation mean?
It signals strong hands betting on higher prices, creating a supply wall that could act as price support.
Will BTC break $80K soon?
Thin supply there boosts chances—watch ETF flows and macro calm.
Is $70K Bitcoin’s new floor?
Data says yes, with 9% of supply anchored nearby. Dips below get bought.
How reliable is Glassnode’s URPD metric?
Highly—entity-adjusted for accuracy, tracking real holder costs.